Friday, 28 November 2014

Winter Deaths are a Fifth of 1950 / 1951 Levels

The BBC News website is reporting that the winter of 2012 / 2013 resulted in the least number of cold weather related deaths since records began. Such deaths are typically due to heart disease, stroke and respiratory illness affecting the elderly during the cold winter months.

A quick analysis of the ONS Statistics behind this shows that today's winter mortality rates are less than a fifth of the 1950 / 1951 winter rates, mainly due to better home insulation:

Source: ONS Figures

Thursday, 27 November 2014

Benefit Fraud, Immigration and Europe are Not Bankrupting Britain - Not Even Close

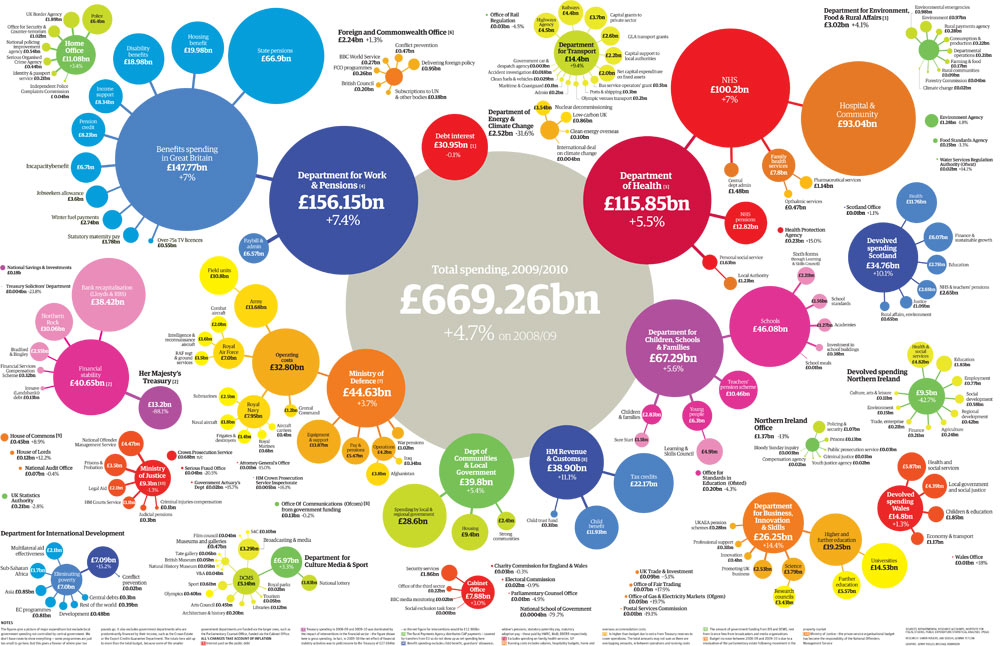
An excellent info-graphic on government spending in The Guardian website from 2010 / 2011 (so from before the government austerity cuts kicked in) shows the breakdown of spending by department, and then broken down further by what each department was spending on. Yes, I know it's The Guardian, but these are UK Government's own Institute for Fiscal Studies figures.

We have stories about dole scroungers, people unjustly claiming disability allowances and immigrants constantly rammed down our throats by the red-top tabloids, and the 'respectable' media seems blindly to follow whatever moral panic they create.

So, it's worth delving a bit into some context on exactly how big a deal spending on these items actually is to see if it really is a problem worth devoting so many rabid column inches to or not.

Source: The Guardian
You have to click on the link to the original info-graphic to explore it properly, but let's do a bit of digging by theme, taking each one as a proportion of that total £669.26bn spend:
  • "Dole Scrounging is Bankrupting Britain"Job Seekers allowance (£4.5bn) and Income Support (7.8bn) made a total of £12.3bn which is just 1.8% of the total spend. Let's say for the sake of argument that 10% of this was claimed illegally, that would be 0.18% of government expenditure. And that's from before the cutbacks kicked in!
  • "Malingerers 'On The Sick' are Costing Taxpayers Dearly"
    Disability Living Allowance (£17.2bn) and Incapacity benefit (£7.8bn) made a total of £25bn which is just 3.7% of the total spend. Again, if we say for the sake of argument that 10% of this was claimed unscrupulously then that would be 0.37% of total spend. And that's from before the DWP's Fit For Work assessments kicked in and forced a load of people back into the job market.
  • "Immigrants on Housing Benefit are Bleeding us Dry"
    Housing benefit cost us £21.6bn which is 3.2% of total expenditure. Assuming 10% of that was claimed by Johnny Foreigner and their brand new flat screen TVs then that would be 0.32% of total government expenditure.
If we add all those speculative 10%'s together, then these much hyped scandals that are supposedly bleeding us dry cost us 0.88% of our total spend at just under £5.9bn. And bear in mind those 10% figures are totally speculative, nobody's suggesting anything like that is really claimed fraudulently.

On the subject of Europe, which is very much in the news thanks to UKIP:
  • "The European Commission are Milking us for Every Penny"
    Nice try Mr Farage, but payments to the EC came in at £1.3bn which is 0.19% of our total expenditure. We spend almost as much on the World Bank at £926.7m (0.14%) but oddly that never makes the headlines. Incidentally, the spending on our MEPs in the £570m Cabinet Office budget is so small it wont even display in the info-graphic.
So where is the money going? Well £69.8bn (approx 10%) goes on our pensions, £58.3bn (approx 9%) goes on education, £105.6bn (approx 16%) goes on healthcare, £39.5bn (approx 6%) on defence and so on.

To give it some further perspective, we spent more on the Welsh Government than we did on 'dole'. And we spent more on giving ourselves tax credits than we did on disability and incapacity benefits, but you don't hear anybody calling for cutbacks there do you? Strange that....

Vinyl Sales Highest Since Mid-Ninties

The British Phonographic Industry (BPI) have released sales figures for vinyl records which show that sales are at their highest in 2014 since 1995:


Once written off as an archaic medium in a digital era, vinyl has staged somewhat of a comeback in the last four years. 

A brief scan of the vinyl charts reveals the upsurge is thanks to some familiarly old-school names, such as Pink Floyd, David Bowie, Led Zeppelin, Oasis and the Stone Roses:

Official Vinyl Albums Chart – year-to-date top 10 artist albums (up to & incl. w/e 22 November 2014):

Position
Title
Artist
1
AM
ARCTIC MONKEYS
2
LAZARETTO
JACK WHITE
3
THE ENDLESS RIVER
PINK FLOYD
4
ROYAL BLOOD
ROYAL BLOOD
5
DEFINITELY MAYBE
OASIS
6
THE STONE ROSES
STONE ROSES
7
THE DARK SIDE OF THE MOON
PINK FLOYD
8
LED ZEPPELIN
LED ZEPPELIN
9
LED ZEPPELIN 3
LED ZEPPELIN
10
LED ZEPPELIN 2
LED ZEPPELIN
Source: BPI

Wednesday, 26 November 2014

Air Pollution Peaked Around 2003 and is Starting to Reduce

DEFRA released a report in April 2014 called Air Quality Statistics In The UK, 1987 to 2013 measuring air pollution since 1987 to the present day.

It's a mixed bag of results, but in general air pollution in the form of particulates (PM10) and Ozone peaked around 2003 and is slowly being reduced. The main exception being urban ozone levels, which have continued to rise:


If we measure that in terms of the number of days per year when air pollution is 'moderate' or 'high' then we can see a steep decline since 2003 to levels below where we were in 1987, despite there being many more cars on the road than there was back then:


Particulate matter, nitrogen dioxide and sulphur dioxide are down hugely since 1992:


One of the reasons for this is that cars are vastly cleaner than they used to be. The amount of CO2 released by cars has reduced by 15.1% since the year 2000, despite the overall number of cars increasing:

Source: Department for Energy and Climate Change (DECC)

The following graph from the Department for Transport (DfT) shows how CO2 emissions from all cars in use have declined relative to the total number of miles being driven by Britain's cars. Driving style, vehicle maintenance and road conditions also strongly influence total emissions:
Source: Department for Energy and Climate Change (DECC)

Another view of this is from DfT figures released in December 2013 which show that the average CO2 emissions of a newly registered car has reduced from 177.8 g/km to 128.4 g/km:
Source: DfT Statistics


Urban Rivers Cleanest for 20 Years

As a result of the industrial revolution in the 18th and 19th centuries, urban rivers in the UK often contained completely unregulated discharges from metal working, chemical factories, household sewerage, mining, dye works, textiles, potteries and polluted rain water run-off.

As detailed in the following Environmental History website, in the first half of the 18th century, London, the largest city in Europe apart from Paris, which had one million inhabitants by 1850, experienced a series of recurring epidemics of cholera and typhoid. London experienced terrible Cholera outbreaks as a result, caused by increasing amounts of sewage dumped into the Thames.

The tide started to be turned, so to speak, by public drainage works like the Thames Embankment in response to the Great Stink of the summer of 1858. But urban rivers remained horribly polluted well into living memory, with industrial effluent often being pumped into rivers largely unchecked as recently as the 1950's.

Various acts of parliament were passed to tackle the issue, such as the Control of Pollution Act (COPA) 1974, the Environmental Protection Act 1990, the Water Resources Act 1991 and the Environment Act 1995 and things gradually began to improve.

Source: BBC News
But the good news is that things are continuing to improve. According to a study by Cardiff University's School of Bio-Sciences, reported on the BBC News site in June 2014, urban rivers are the cleanest they have been for 20 years.

According to DEFRA stats from 2010 UK rivers are increasingly clean of chemical and biological pollutants, showing improvements even from as recently as 1990:


Source: DEFRA River Quality Indicators
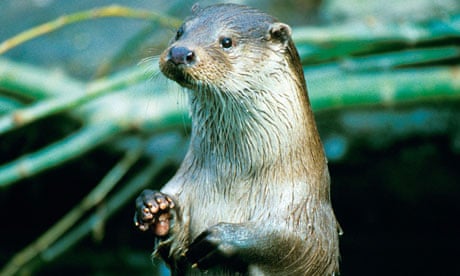
These days, there are many encouraging indicators from the return of salmon spawning to industrial rivers, the return of otters to every county in England, and the increasing popularity of wild swimming.

Source: The Guardian

Tuesday, 25 November 2014

The ICT Development Index

The International Telecommunication Union (ITU) ran a report in November 2014 on the global state of information and communications technology (ICT) called the Measuring the Information Society Report 2014.

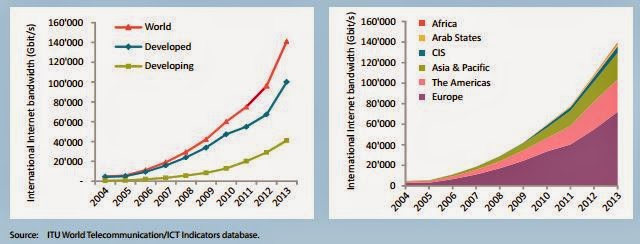
Whilst it's hardly on a par with things like access to clean water, nutrition, education and sanitation etc. it's easy to forget from a Western perspective just how revolutionary and democratising communications technologies are. So it's pleasing to see that measures like internet bandwidth are increasing across both the developed and developing world:


Likewise, the number of households with internet access is increasing across all regions, with 31.2% of even developing world households now having internet access:


The global nature of the internet can be seen here in a measure of the growth of Wikipedia articles in English and non-English languages, showing how other languages dominate the number of articles on the site:


From a UK perspective, the UK has also happily jumped from 7th to 5th place globally in the ITU's ICT Development Index (IDI), above countries like the US, France, Germany and Australia, based on things like ICT access, ICT usage and ICT skills:


The Rise of the Co-Operative

Co-operative businesses are owned and run by and for their members, whether they are customers, employees or residents. Whereas normal businesses work towards giving a return on investment to shareholders, necessitating taking a slice of value from their own customers and employees, a co-operative business works in a more equitable way.

In a world where corporations are increasingly seen as money-grabbing, cost-cutting and even downright dishonest, an organisation built for mutual benefit seems like an attractive proposition. Some famous examples include John Lewis, the Co-Operative Bank and The New Internationalist, but there are co-ops in every sector of the UK economy.

The co-op trade association Co-Operatives UK shows that the co-op sector has continued to grow throughout the recent economic woes:

Source www.uk.coop

And the number of co-operatives registered continued to grow during the downturn:

Source www.uk.coop

Whether or not the rise of co-ops and the democratisation brought by the Internet really brings about the death of the traditional capitalist corporation, as was postulated in the Guardian by political and economic advisor to the EU Jeremy Rifkin remains to be seen, but it's interesting times for equitably organised co-operative model business.